Source: securityboulevard.com – Author: Gilad David Maayan
Elastic Security, which includes Elastic security information and event management (SIEM), is a comprehensive security solution developed by Elastic. It combines various security tools and features to help organizations detect, prevent, and respond to cyber threats in real-time.
Elastic Security leverages the capabilities of the Elastic Stack, a suite of open source tools, including Elasticsearch, Logstash, Kibana and Beats, to provide powerful search, analytics and visualization capabilities.
Elastic SIEM Features
Here are some of the main features of Elastic SIEM:
- Data ingestion: Elastic SIEM collects security events and logs from various sources, including network devices, endpoints and third-party security tools. It then processes and stores this data in Elasticsearch for further analysis.
- Real-time monitoring: Elastic SIEM allows security teams to monitor security events, manage logs and receive real-time alerts, providing a comprehensive and up-to-date view of an organization’s security posture.
- Advanced analytics: The solution uses machine learning and advanced analytics techniques to identify anomalies, patterns and potential threats in the collected data. This helps security teams quickly detect and investigate security incidents.
- Customizable dashboards: Elastic SIEM includes pre-built dashboards and visualization tools through Kibana, enabling security teams to create custom views and visualizations of security data. This helps teams monitor and analyze security events, trends and patterns more effectively.
- Alerting and notifications: Elastic SIEM provides a flexible alerting system that allows security teams to create custom rules and receive notifications on potential threats. This helps ensure that teams are promptly alerted to critical security incidents.
- Incident response and case management: Elastic SIEM includes case management features that help security teams organize and manage security incidents. This streamlines the incident response process, enabling teams to collaborate more effectively and resolve security issues faster.
- Threat hunting: Elastic SIEM enables proactive threat hunting by providing powerful search and analytics capabilities, allowing security teams to investigate potential threats and uncover hidden patterns.
- Integration with other security tools: Elastic SIEM supports integration with various third-party security tools and platforms, enabling organizations to build a customized security ecosystem that meets their specific needs.
- Scalability and flexibility: Elastic SIEM can scale horizontally and vertically to handle large volumes of data, making it suitable for organizations of all sizes. Additionally, it is built on the Elastic Stack, which provides powerful search, analytics and visualization capabilities, ensuring that Elastic SIEM remains a robust and flexible security solution.
Elastic Security Components and Workflow
The diagram below depicts the workflow of Elastic Security.
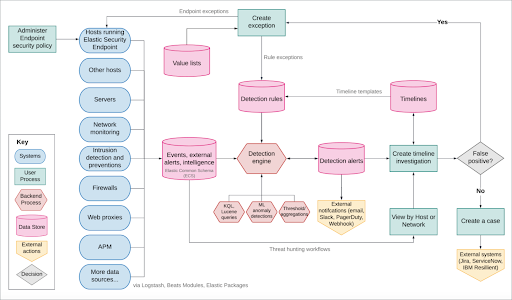
Image Source: Elastic
Data Flow
Data from the hosts is sent to Elasticsearch through the following methods:
- Elastic Defend: An Elastic Agent integration that safeguards the hosts against malware and sends the following data sets:
- Windows: Process, file, network, DNS, driver and DLL loads, registry, malware security detections
- Linux/macOS: Process, file, network
- Integrations: These offer a simplified method for transmitting data to the Elastic Stack from popular platforms and services, such as Nginx, MongoDB and AWS, as well as various generic types of inputs such as log files.
- Beat modules: A beat functions as a lightweight data shipper, and Beat modules enable the collection and parsing of certain data sets from common sources, including cloud and operating system events, metrics and logs.
Elastic Security Kibana Application
The Elastic Security application in Kibana manages the Detection engine, Timeline, Cases and administration of hosts that run Elastic Defend:
- Detection engine: Automatically searches for unusual network and host activities using:
- Detection rules: Regularly scan data from the hosts for abnormal events. When a suspicious event is found, the engine generates an alert. External systems like email and Slack can be used to send notifications when the alerts are produced. You can create custom rules or use prebuilt rules.
- Exceptions: Decrease noise and false positives by associating exceptions with rules, preventing alerts when exception conditions are met. Value lists include source event values that can serve as part of the exception conditions. Once Elastic Defend is installed on the hosts, malware exceptions can be added directly to the endpoint from the Security application.
- Machine learning jobs: Automatically detect anomalies in network and host events. Anomaly scores are given for each host and can be combined with detection rules.
- Timeline: A workspace for examining events and alerts. Timelines employ queries and filters to delve into events related to specific incidents. Timeline templates are connected to rules and use predefined queries when investigating alerts. Timelines can be shared, saved and attached to Cases.
- Cases: An in-app system for opening, sharing and tracking security issues within the Security application. Cases can be integrated with a ticketing system.
- Administration: Monitor and manage hosts that run Elastic Defend.
Using Elastic Security for SIEM
Elastic Security combines Endpoint Security and Elastic SIEM with its automated threat detection engine that enables investigation and response to threats into a unified solution that consolidates prevention, detection and response across the entire network.
To begin, you only need an email address and either a virtual or local machine where you can capture data from network packets.
Create a Deployment
Elastic Cloud deployments provide all Elastic Stack features through a hosted service. You can get started with a deployment for free by signing up for the Elastic Cloud trial:
- Visit the Elastic Cloud trial page.
- Provide an email address and password.
- Once logged in, you can immediately start creating your deployment. Assign a name to the deployment and click Create deployment.

Image Source: Elastic
- As the deployment is being set up, write down the superuser password for your Elastic account and store it securely.
- When the deployment is ready, click Continue. You will now have access to Kibana and be prompted to either Add integrations or Explore on your own. You can navigate back to Kibana’s home page at any time by clicking the Elastic logo.
The deployment comes with a pre-configured Fleet Server instance which manages the Elastic Agents that can be used to monitor host systems.
Add the Data Capture Integration
To add the network packet capture integration to the local or virtual machine:
- Sign in to the cloud deployment to go to the Kibana homepage.
- Select Add integrations.
- Type “Network Packet” in the search bar and choose the Network Packet Capture integration.
- Click on Add Network Packet Capture.
- Set up the integration’s configuration:
- Integration name: Assign a name to the integration.
- Description: Provide a short description of the integration.
- New agent policy name: As you will be creating a new policy, you need to specify a name for it. Make sure that the Collect system logs and metrics option is selected.
- Click on Save and continue to move forward. This may take a minute or two.
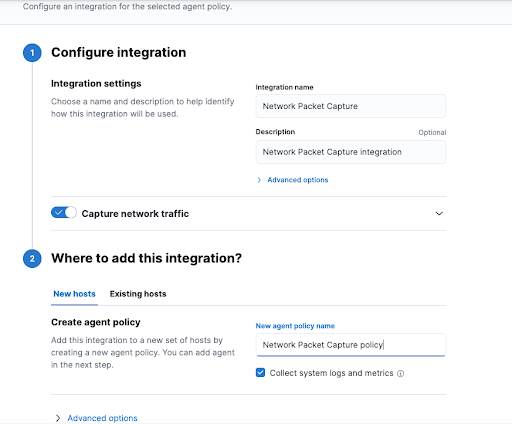
Image Source: Elastic
After completing these steps, click on Add Elastic Agent to your hosts in the subsequent dialog that appears. The Add agent flag will be displayed.
Install the Agent on the Machine
Elastic Agent is a unified, extensible agent that powers integrations and protects hosts from threats within the Elastic Stack. It is designed to simplify data collection, monitoring and security by consolidating multiple data collection capabilities into a single agent. Each agent must have only one policy, which defines the integrations and configurations it should follow.
When adding an agent, you’ll encounter the Add agent flyout with two tabs: Run standalone and Enroll in Fleet. The Run standalone tab is for deploying the agent without connecting it to a centralized Fleet Server, while the Enroll in Fleet tab is for connecting the agent to the Fleet Server, which enables central management and monitoring.
To install the agent on the host machine, follow these three steps:
- In the Add agent flyout, under the Enroll in Fleet tab, skip the Select enrollment token step, as it is not needed in this scenario.
- Download the Elastic Agent by clicking the appropriate download link for your host’s operating system. Once downloaded, install the agent on your host machine following the provided installation instructions.
- Enroll the agent in your deployment’s Fleet Server using the provided command. This establishes a connection between the agent and the Fleet Server, allowing for centralized management.
The installation and enrollment process should take a minute or two to complete. After it’s done, you can close the Add agent flyout.
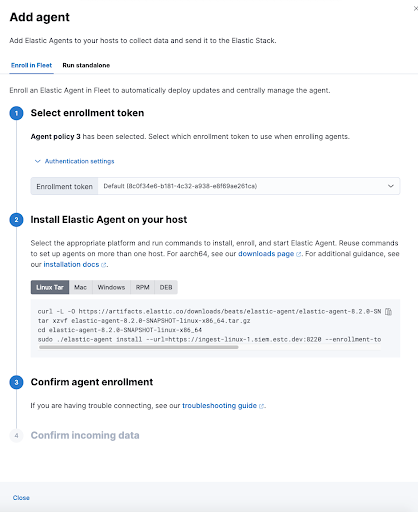
Image Source: Elastic
View the Data
After adding the Elastic Agent, you can view the data by selecting Installed integrations under Management in the left-hand navigation menu. Click on Network Packet Capture and then Assets. The integration’s assets are organized into categories such as dashboards, visualizations and pipelines, which help users efficiently explore and analyze the collected data.
The image below displays the Network Packet Capture integration’s DNS overview dashboard, offering a graphical representation of metrics related to DNS requests and responses.
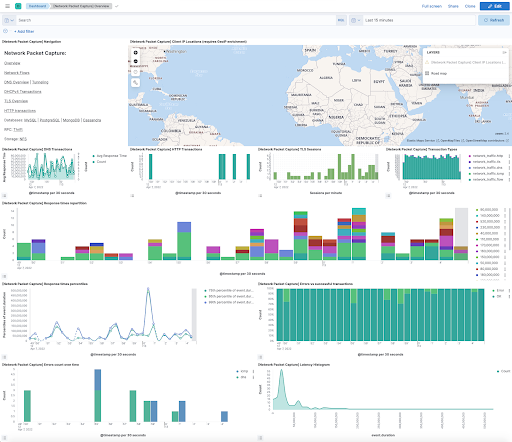
Image Source: Elastic
Conclusion
This comprehensive guide to Elastic SIEM provided a detailed understanding of its features, components and capabilities. By using Elastic SIEM, you can centralize security monitoring, analysis and management across your organization, enhancing your ability to detect and respond to potential threats.
Through the Elastic Stack’s integrations, you can easily add new data sources and visualize the collected data using built-in assets such as dashboards and visualizations. The Elastic Agent further simplifies data collection and security by consolidating multiple data collection functions into one agent.
By following this guide, you are now familiar with the capabilities of Elastic SIEM, which can help you strengthen your organization’s security posture and respond to threats more effectively.
Recent Articles By Author
Original Post URL: https://securityboulevard.com/2023/05/complete-guide-to-elastic-siem/
Category & Tags: Application Security,Cloud Security,Cybersecurity,Endpoint,Incident Response,Network Security,Security Boulevard (Original),Elastic,elastic siem,open source,security information event management,SIEM – Application Security,Cloud Security,Cybersecurity,Endpoint,Incident Response,Network Security,Security Boulevard (Original),Elastic,elastic siem,open source,security information event management,SIEM
Views: 3