Source: socprime.com – Author: Oleh P.

Step 1:Write a Query to Monitor Multiple Sources
- Identify the log sources you want to monitor.
- Create a Splunk search query that checks for events from those sources within a specific timeframe.
- Example query:
Query without additional fields
| makeresults | eval source=split("source1,source2,source3", ",") | mvexpand source | join type=left source [ search index= earliest=-1h | stats count by source ] | fillnull value=0 count | where count = 0 Query with additional fields “message”
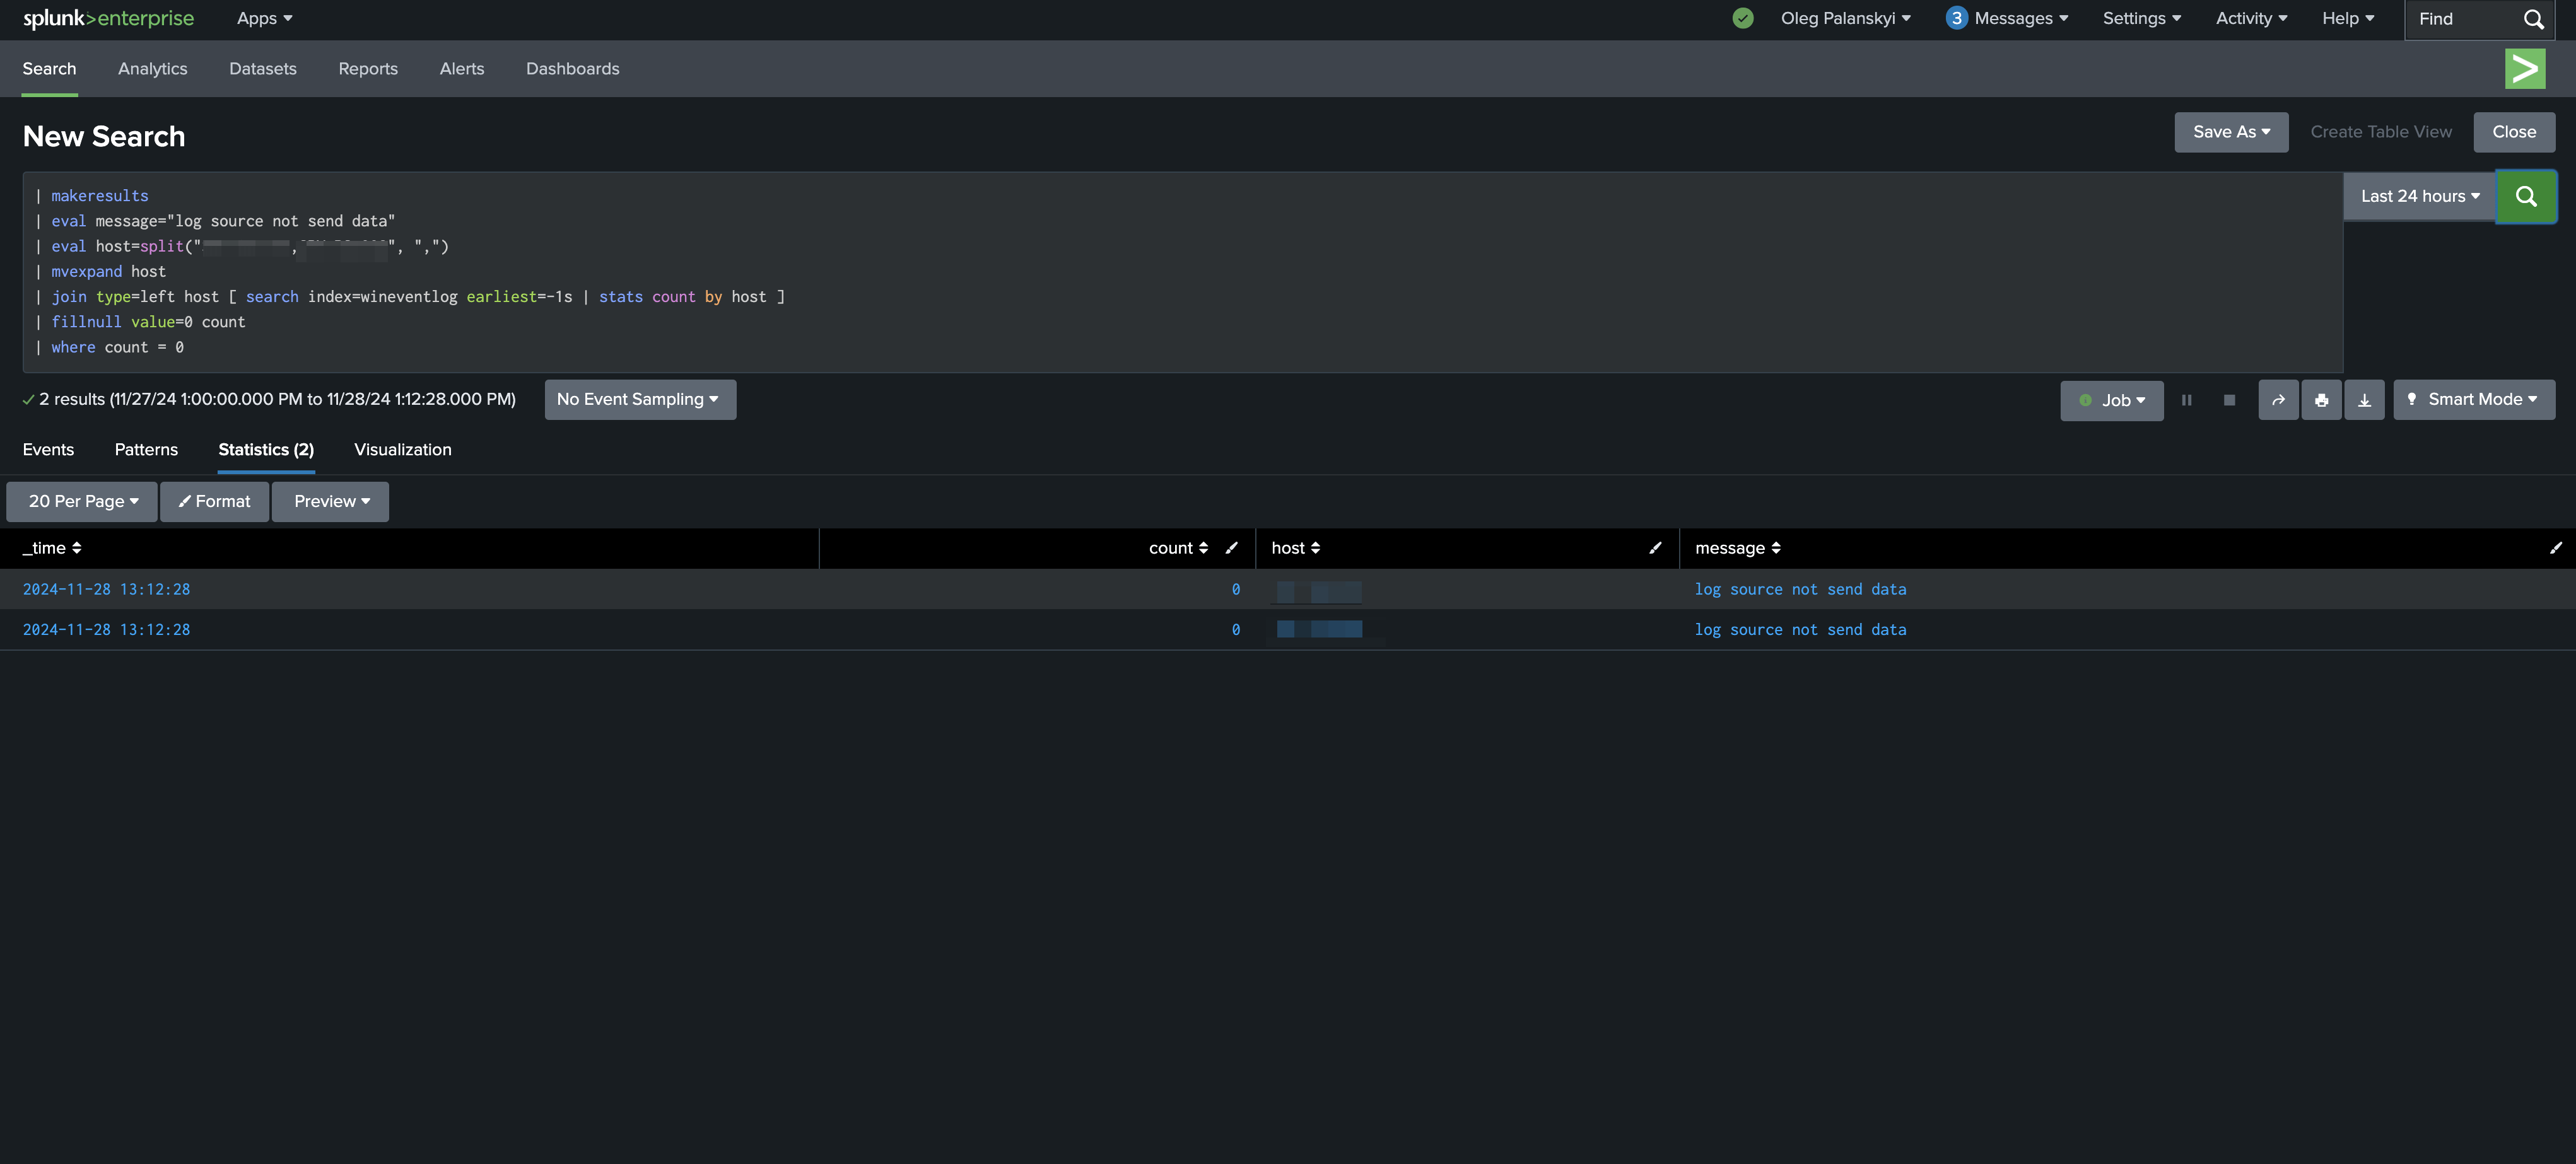
| makeresults | eval message="log source not send data" | eval host=split("XXX-XX-XXX,XXX-XX-XXX", ",") | mvexpand host | join type=left host [ search index=wineventlog earliest=-1h | stats count by host ] | fillnull value=0 count | where count = 0- earliest=-1h: Searches for events in the last 1 hour.
For example, on the screenshot, I set two hosts to monitor and earliest -1s for testing.
Now, if they stop coming, you will see results like on the screenshot.
Step 2: Create an Alert
- In Splunk:
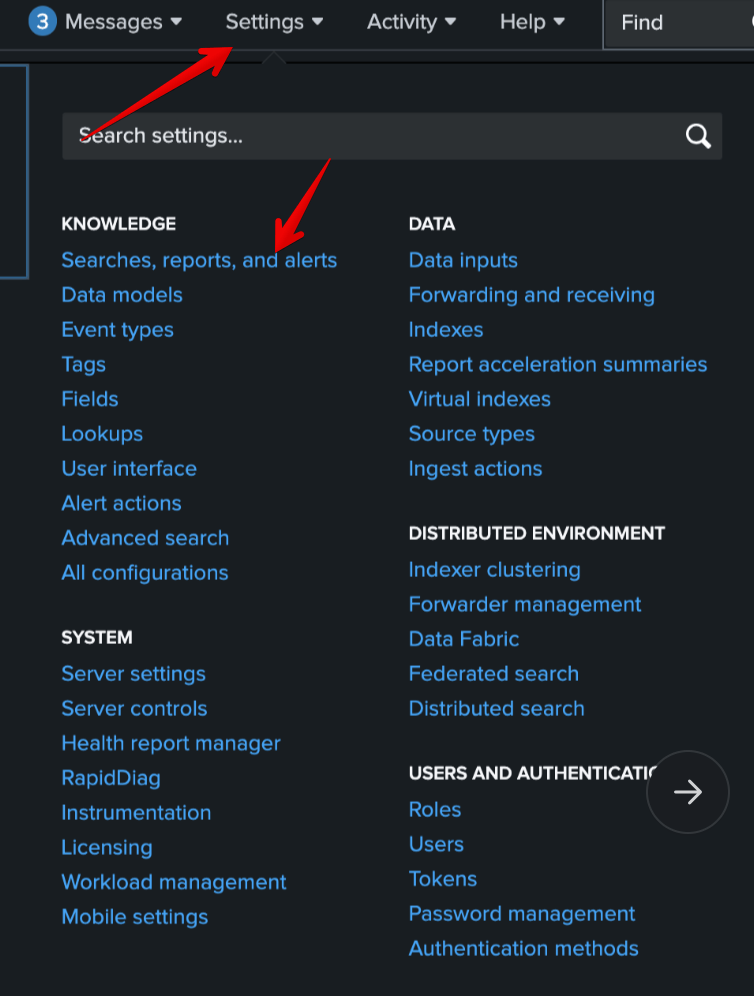
- Go to Settings > Searches, reports, and alerts.
- Click New Alert.
- Configure the New Alert:
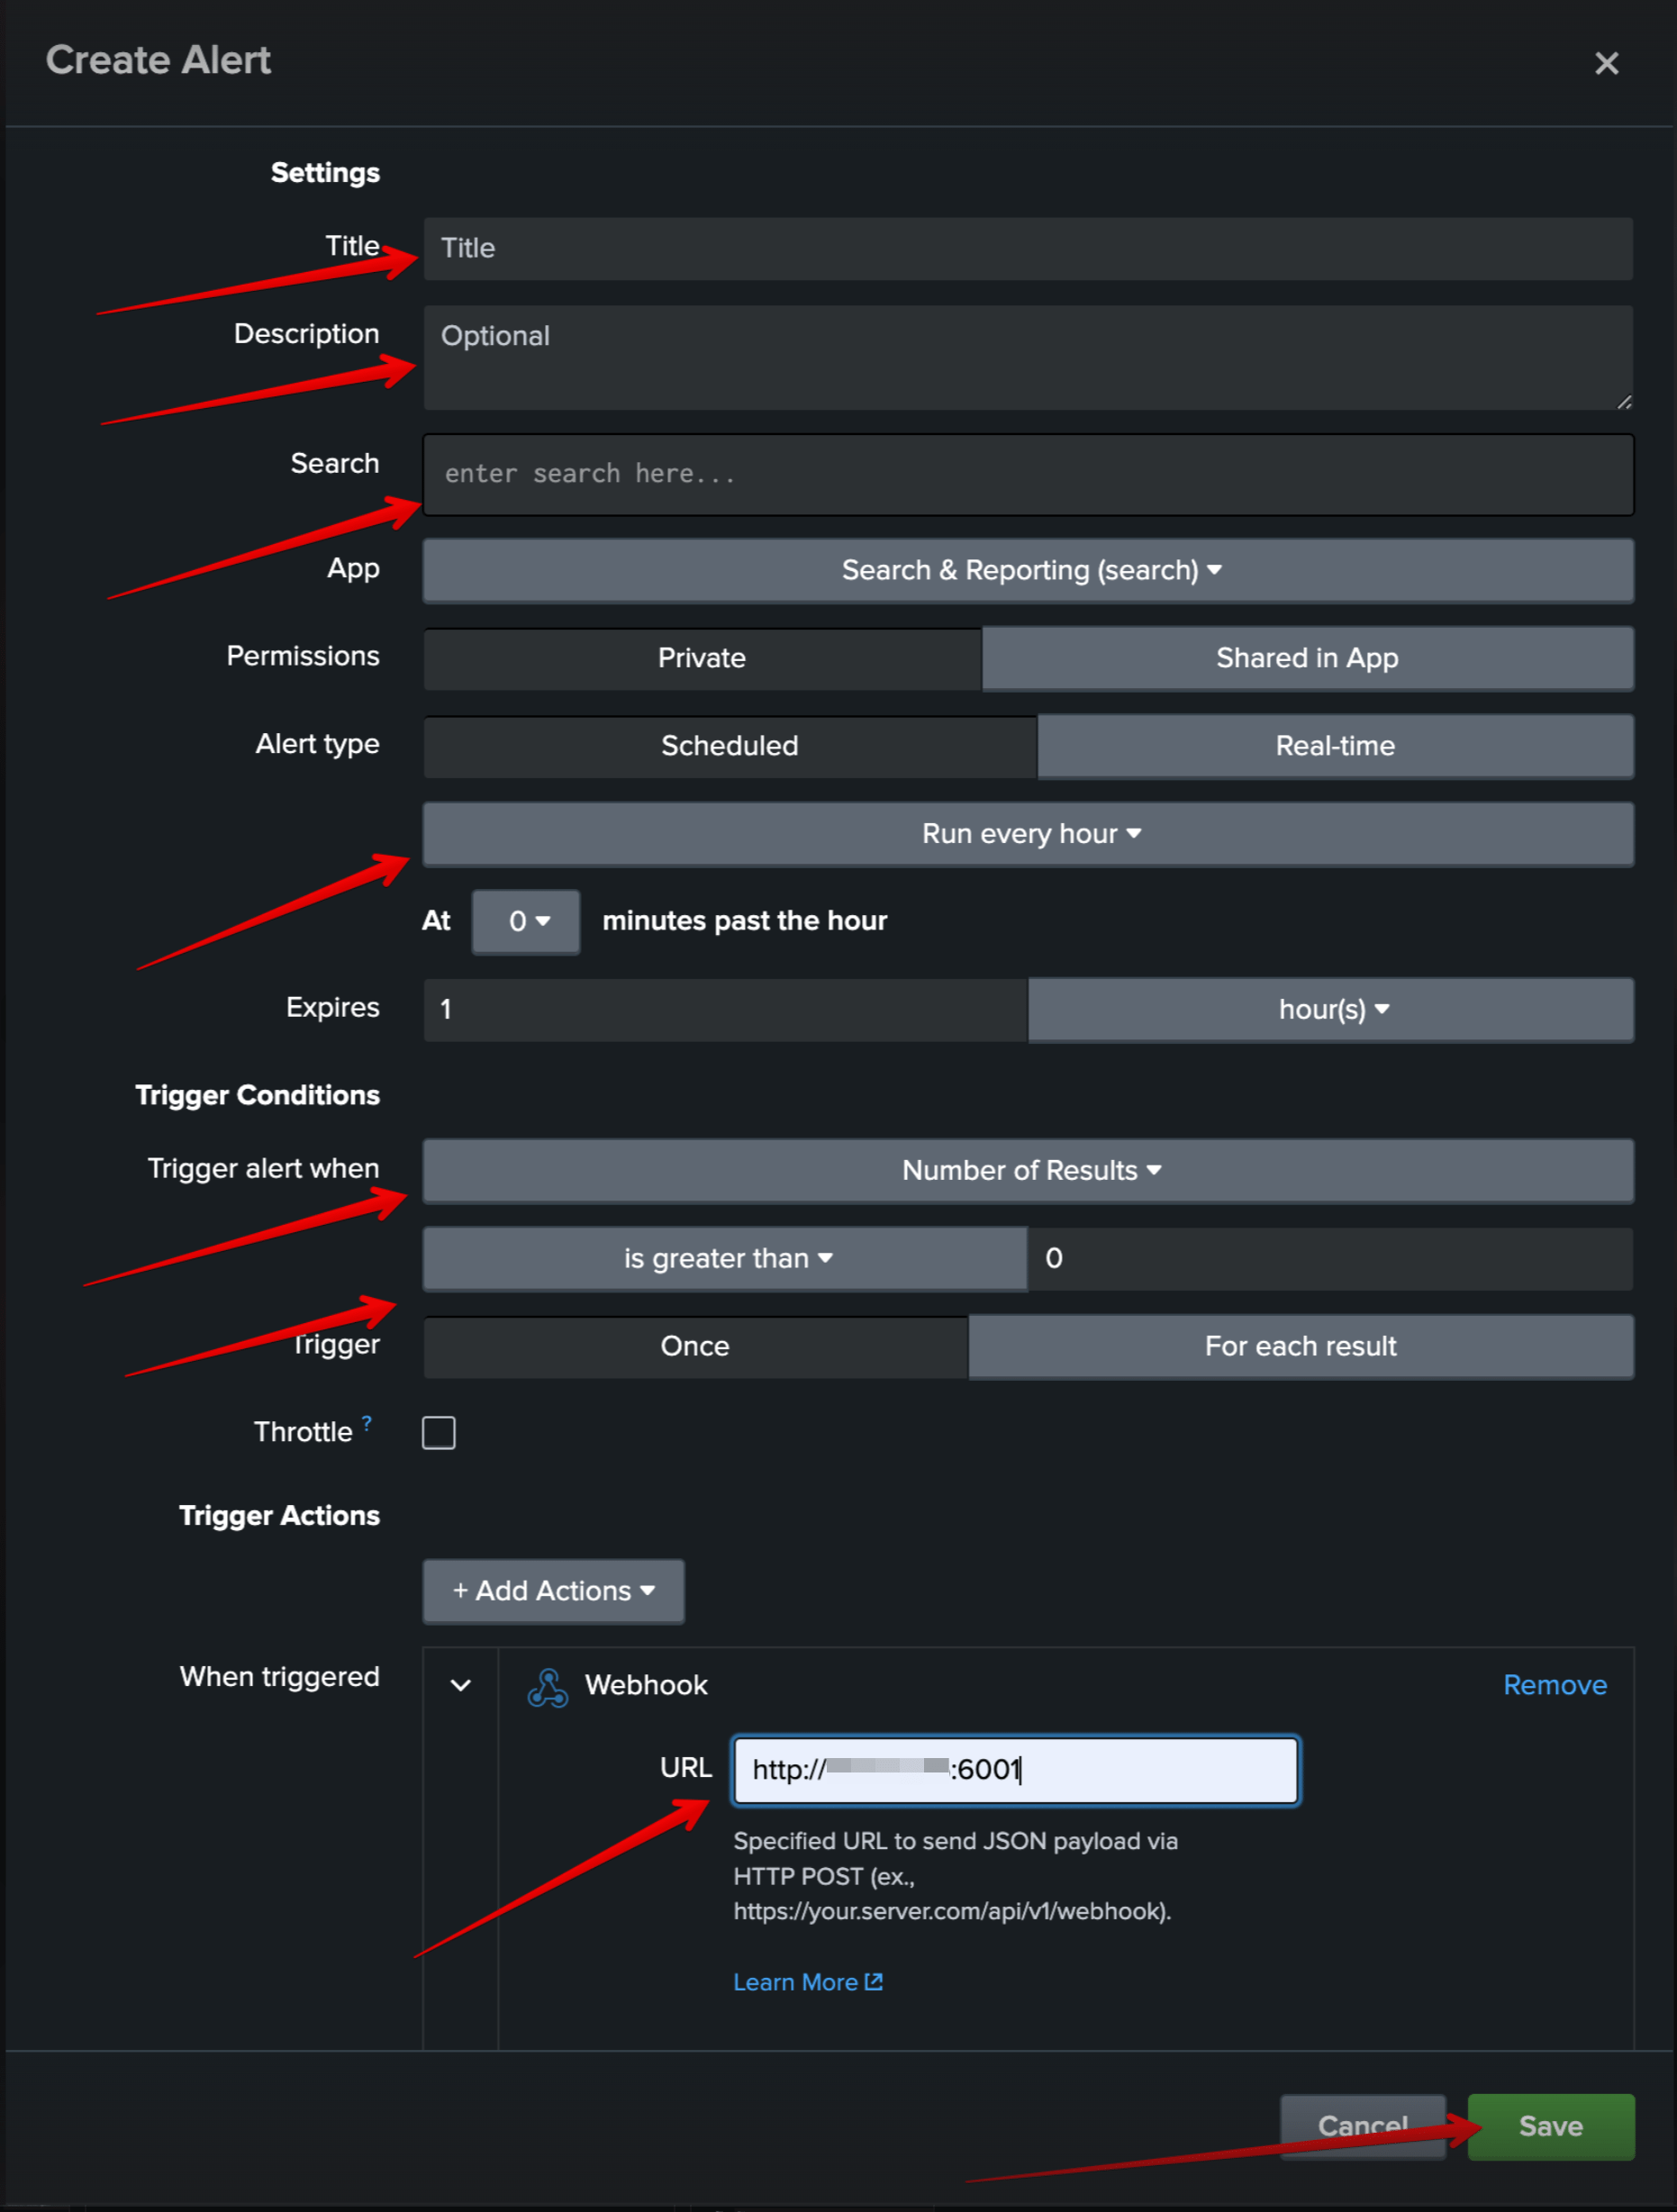
- Title the alert (e.g., Multiple Source Monitor).
- Description (Optional)
- Search (your write query in step 1)
- Set the alert to run on a schedule (e.g., every 5 minutes or hourly).
- Trigger when the number of results (sources with zero logs) is greater than 0.
- Set action when triggered (For example, webhook)
- Save alert
Finally, you will see your alert, and when it’s triggered, you will see it
For example, on the screenshot, I set sending to http port



Was this article helpful?
Like and share it with your peers.
Related Posts
Original Post URL: https://socprime.com/blog/splunk-how-to-write-a-query-to-monitor-multiple-sources-and-send-alert-if-they-stop-coming/
Category & Tags: Blog,Knowledge Bits,SIEM,Splunk – Blog,Knowledge Bits,SIEM,Splunk
Views: 7


